Get help with creating custom data tables
This section is Guidance
Learn how you can explore and customise detailed trade data using the interactive data tables on our site.
Contents
- Before you start
- Voice navigation and keyboard command steps
- Select a dataset to explore
- Change the default table view
- How to explore table rows
- How to customise the data table
- Find data by commodity code or description
- Find data by country
- Find data by UK port
- Select a date period
- Find data by trade flow
- How to sort the data by value
- Save or share a data table
- Summing up rows in a CSV download
- If you need help with this service
Before you start
Read our detailed guide to using our data to:
- learn more about this data and our data sources
- understand key terms and definitions
- find out about methods we use to produce statistics
You can also read our guide to how goods are classified. This will help you to understand these goods classification systems:
- the Standard International Trade Classification (SITC) system
- the Harmonised System (HS)
- Combined Nomenclature (CN)
The guide will also show you how:
- commodity codes are structured
- to compare goods in different classification systems
If you need large volumes of trade data, you can download these to use with your own software:
You can also access our data using our API service.
Change CSV files to table format
Open the Excel report you have downloaded and follow these keyboard commands to convert the file.
- Select Ctrl + A to select all the cells.
- Select ALT + N + T.
- Select OK on the box that appears.
Access commodity code links
Follow these keyboard commands to open the commodity codes.
- Use the tab key to navigate down the page until 'Press Ctrl + Enter to interact with the report' appears and follow that step.
- Tab down until you reach a menu of three items.
- Tab down to select 'Skip to main content' and select Enter.
- Use the down arrow until a border above the 'Commodities' section appears and select Enter to select a row.
- Use the left arrow to move the cursor to 'All Commodities', where the + sign indicates you can expand the rows.
- Select Shift + the right arrow key for commodities to open.
Access more table function options
Follow these keyboard command steps to open a menu with more table function options.
- Use the tab key to navigate down the page until you reach 'Press Ctrl + Enter to interact with the report' and follow that step.
- Tab down until you reach a menu of three items.
- Tab down to select 'Skip to main content' and select Enter.
- Use the down arrow until a border above the 'Commodities' section appears and select Enter.
- Use the left arrow to move the cursor to 'All Commodities'.
- Select Shift + the right arrow key for commodities to open.
- Select Shift + Alt + F10 for the context menu to appear.
View the data as an html table
Follow these keyboard command steps to activate an html version of your table.
- Use the tab key to navigate down the page until you reach 'Press Ctrl + Enter to interact with the report' and follow that step.
- Tab down until you reach a menu of three items.
- Tab down to select 'Skip to main content' and select Enter.
- Use the down arrow until a border above the 'Commodities' section appears and select Enter.
- Use the left arrow to move the cursor to 'All Commodities'.
- Select Shift + the right arrow key for commodities to open.
- Select Shift + Alt + F11 for the html table to appear.
Select a dataset to explore
You can choose from:
There are key differences between the different types of datasets.
Overseas trade by commodity code
This provides:
- monthly UK import and export trade data from 2000 to the latest period
- HS commodity data at 2-, 4-, and 6-digit levels
- CN commodity data at 8-digit level
- EU estimates for non-response and Below Threshold trade at HS 2-digit level
- UK port data (place of clearance)
Note that trade suppressed to protect confidentiality gets published at HS 2-digit level.
Overseas trade by Standard International Trade Classification (SITC):
This provides:
- monthly SITC correlation of the Overseas Trade Statistics (OTS) from 2000 to the latest period available
- SITC commodity data at the 1- to 5-digit levels
- EU estimates for non-response and Below Threshold trade at SITC 2-digit level
- UK port data (place of clearance)
Note that trade suppressed to protect confidentiality gets published at HS 2-digit level.
Regional trade data:
This provides:
- Regional Trade Statistics data from 2013 to the latest quarter
- OTS imports and exports data, allocated to a standard UK region
Some data may be withheld for confidentiality. Learn more about suppressed data.
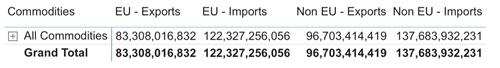
Change the default table view
After you select a dataset, you will see a table. It will group all UK trade data for the latest year available automatically. This will be for all commodities and countries.
Here is how you can view more specific data.
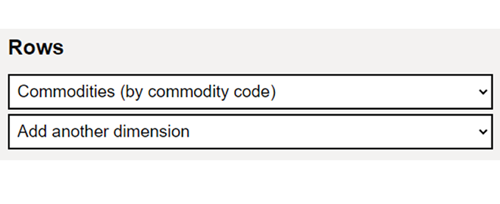
Add or change rows
You can add or change the table rows to change the order in which the data gets presented.
Using the dropdown menu below ‘Rows’, select the first row you want to display in the table.
You can choose from the following types of table rows:
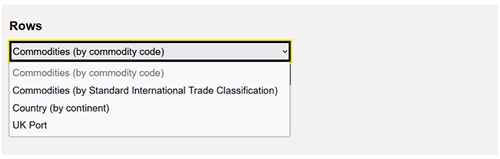
- commodities, organised by:
- HS or CN commodity code
- SITC code
- country, organised by geographical region (shown as ‘continent’)
- UK ports
You can add more rows to the table using the ‘Add another dimension’ dropdown menu.
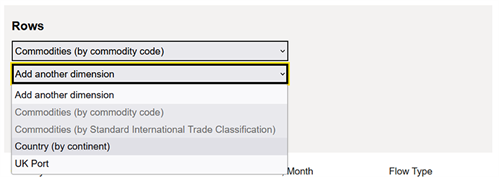
You can add up to three different types of rows.
You cannot add rows in the same table for ‘Commodities (by commodity code)’ as well as ‘Commodities (by SITC)’. This is because they each refer to different systems for classifying goods.
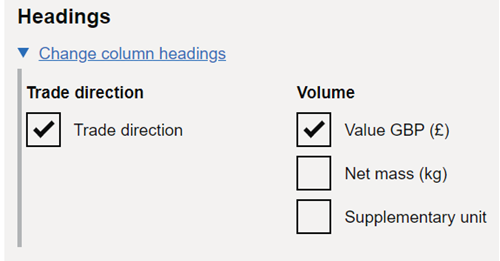
Change column headings
Select Change column headings to show the options for table columns.
Use the checkboxes to select the table columns you want to add.
To change the width of columns in the table (some browsers may not support this feature):
- Hover your cursor between the column headings until a double-headed arrow appears
- Select and drag the column to change its width
Trade direction
Select the Trade direction checkbox if you want to view a breakdown of the trade data by imports or exports. This checkbox is selected by default.
Volume
The Value GBP (£) checkbox gets selected by default. This is to show the reported trade value in pounds sterling (£) in your table.
Select the Net mass checkbox to show data for the net mass of the goods. Net mass means the weight of the goods including immediate packaging. This is shown in kilograms (kg), rounded up to the nearest kilogram.
Select the Supplementary units checkbox to show these units in your table. They are secondary quantities used by some commodity codes. It can refer to:
- square metres
- litres
- grams
- another unit of measure
Note that some commodity codes will not have net mass or supplementary units data.
Also be aware that some commodity groups have different supplementary units. This data will be shown as ‘0’ instead of an actual value.
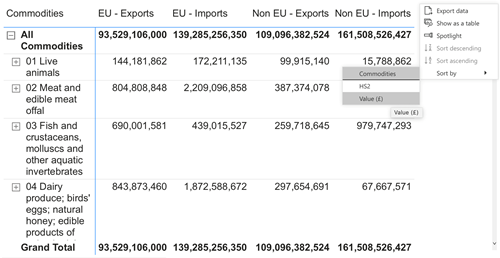
How to explore table rows
Find out how to drill down into a table to view the data in more detail.
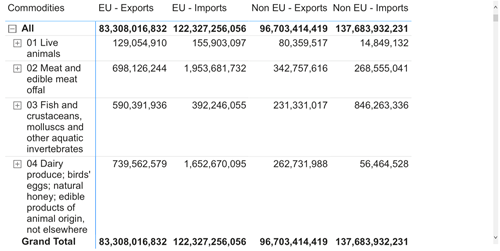
- Select the expand symbol (+) in a table row to show the next level of data.
2. To continue drilling down further, select the expand option (+) on the next row. Repeat this until you find the level of detail you need, or you reach the last level of the data.
In the same way, you can hide table rows by selecting the collapse option (-) on the row.
Note that if you view HS data at 4- or 6- digit level, total values shown will not include the value of any suppressed data.
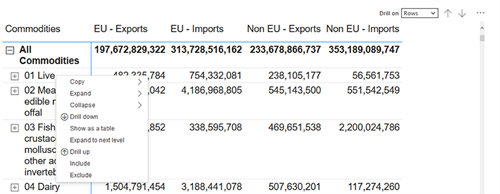
There is another way of drilling down within the table itself. Right click on your cursor for this menu to appear. It also allows you to expand and contract the rows.
Keyboard shortcuts
You can also use keyboard shortcuts to navigate the data table using a keyboard.
To view a list of available keyboard shortcuts, press and hold Shift on your keyboard, then select the Question mark key.
How to customise the data table
Use the filter options to select and change:
- commodities
- countries
- UK ports
- specific years, quarters or months
- trade flow, such as imports or exports
You can find a guide to each option in the next section.
Filter options are only shown if data is available.
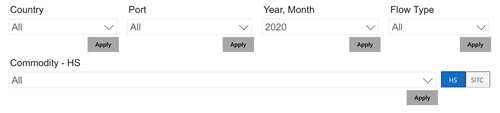
Find data by commodity code or description
To view data at commodity level, select the Commodity dropdown menu.
Next to the dropdown menu, you can select:
- HS to find commodities classified using the Harmonised System
- SITC to find commodities classified using the Standard International Trade Classification
You can add as many commodities to a table as needed.
You can find a commodity to add to the table by using the search field in the dropdown menu. You can enter either a commodity code or a description to view suggestions.
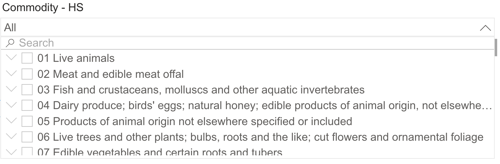
Or, use the down arrow (V) symbol to expand a section. Then drill down to specific commodities or commodity groups.
You can scroll down the list to view more commodities.
Select the checkbox next to the commodity to add it to the table, or deselect it to remove it.
When you have finished adding commodities, select Apply to update the table.
Find data by country
To view data at country level, select the Country dropdown menu.
You can add as many countries to a table as needed.
You can find a country to add to the table by using the search field in the dropdown menu. You can also scroll down to view more countries.
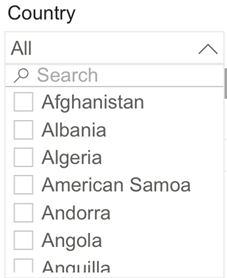
Or, use the down arrow (V) symbol to expand a section and drill down to specific countries or geographical regions.
Select the checkbox next to the country to add it to the table, or deselect it to remove it.
When you have finished adding countries, select Apply to update the table.
Find data by UK port
To view data at UK port level, select the Ports dropdown menu.
You can add as many UK ports to a table as needed.
You can find a port to add to the table by using the search field in the dropdown menu.
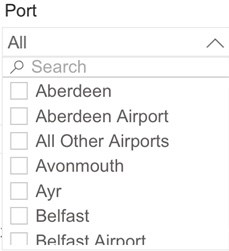
Or, use the down arrow (V) symbol to expand a section and drill down to specific ports.
You can scroll down the list to view more ports.
Select the checkbox next to the port to add it to the table, or deselect it to remove it.
When you have finished adding ports, select Apply to update the table.
Special note about Dover port codes
In 2021, HMRC introduced a new port code: 'Dover / Eurotunnel'. This was so that traders could submit Customs Declarations before deciding on transport mode.
As a result, to calculate trade totals for Dover, select both of these ports from the filter:
- ‘Dover’
- ‘Dover/Eurotunnel
A complete list of freight location codes are available from GOV.UK.
Select a date period
You should note:
- Overseas Trade Statistics data is available monthly
- Regional Trade Statistics data is available quarterly
To view overseas trade data for a specific period, select the Year, Month dropdown menu.
If you are viewing regional trade data, a Year, Quarter dropdown menu will be shown instead.
By default, the latest year is selected.
You can add several date periods to a table, or select all available years.
Or use the down arrow (V) symbol to expand a year and select a more specific time period within the year.
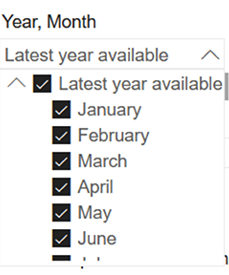
You can scroll down the list to view more years.
Select the checkbox next to the year, month or quarter to add it to the table, or deselect it to remove it.
When you have finished adding date periods, select Apply to update the table.
How to show years, months and quarters
- Hover over the table to show the Drill on option.
- Select the Columns option in the dropdown menu.
- Select the down arrow icon (↓) to the right of the dropdown menu.
- Select a trade flow column to show years.
- Select a year column to show the monthly or quarterly data.
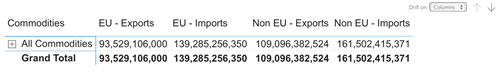
Years, months and quarters are only shown if data is available.
Find data by trade flow
To view data by trade flow, select the Flow type dropdown menu.
You can choose to view any of the following options, or select all:
- EU - Imports
- EU - Exports
- Non-EU - Imports
- Non-EU - Exports
You can add as many to a table as needed.
Select the checkbox next to the trade flow to add it to the table, or deselect it to remove it.
When you have finished adding trade flows, select Apply to update the table.
How to sort the data by value
You can change the order in which data is presented in the table.
By default, the data will be arranged by commodity code in numerical order (for example, 01 before 02).
You may want to view the data by monetary value instead. To do this:
- Hover over the table to show the extra table options.
- Select the More options menu, shown as 3 dots.
- Select Sort by then Value (£).
By default, this sorts the data in descending order, so the largest value is displayed first in the column.
If you have multiple columns in your table, the data will be sorted by the sum of all the values in the row.
If you want the smallest value to be displayed first:
- Hover over the table to show the extra table options.
- Select the More options menu, shown as 3 dots.
- Select Sort ascending.
Save or share a data table
You do not need to register to save a table.
Save your table using the Export data option. You can export up to 150,000 rows using this function. For anything above that, you can use our API service, which we recommend for larger datasets.
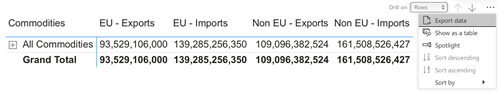
- Hover over the table to show the extra table options.
- Select the More options menu, shown as 3 dots.
- Select Export data
- On the next screen, select the Data with current layout option. This will export data in the same structure as it appears on screen. Note this option is currently only available in .xlsx (Excel) format.
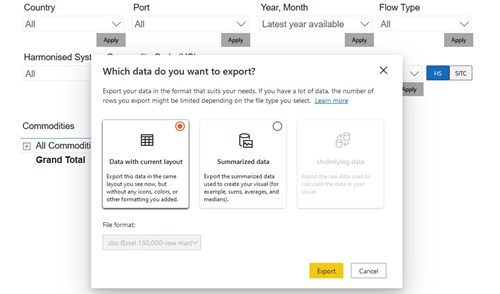
- Selecting the Summarised data option will export your data in the same way as the Download this table in CSV format button.
Or to save a copy of your table to your device, select the Download this table in CSV format button.
![]()
The CSV file will contain the full commodity data in the table. Be aware of this if you are viewing higher-level data in the table shown onscreen.
You can download up to 30,000 rows of data using this option.
Summing up rows in a CSV download
To calculate HS4, HS6, or CN8 totals, rows can be summed up as normal.
When calculating value totals at HS2 level, use these commands in the 'J' column to identify if the row should be included in the aggregation:
- 'INCLUDE'
- 'EXCLUDE'
With Excel, use the SUMIF formula. This is a range of INCLUDE/EXCLUDE values to compare against, INCLUDE, range of ‘values’ to aggregate. An example is SUMIF(I2:I155, INCLUDE, J2:J155). You can also ‘filter’ the data to include and exclude as necessary.
The logic is that an INCLUDE FLAG will display when one of the following conditions is met:
- the row relates to a suppressed commodity
- the CN8 row does not include a suppression
Details for suppressed products get released under an aggregated commodity. This is to protect confidentiality.
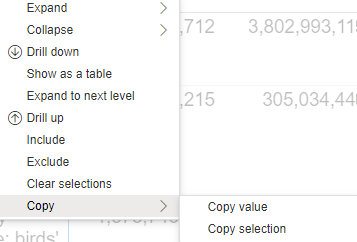
How to copy table data
You can also copy table data to paste into a spreadsheet by following these steps.
- Right-select a row or column heading in the table.
- In the menu that appears, select Copy, then Copy selection.
Or, you can save a table by bookmarking the page, or selecting the Share or link to this table button.
![]()
Copy the link shown to a safe place so you can come back to it later.
If you need help with this service
If you have a question not covered by this guide, email uktradeinfo@hmrc.gov.uk